Blog of Christopher Vachon
  • Home
  • My Feed
  • About Me
  • DevOps
Sign in Subscribe
Web Development

SVG Donut Charts

Christopher Vachon

Christopher Vachon

Feb 7, 2017
SVG Donut Charts

Recently, I wanted to build a simple SVG donut chart to display some data I calculate in a React Application. I did some searching and found an excellent tutorial on Medium by Mark Caron (Scratch-made SVG Donut & Pie Charts in HTML5).  This got me started.

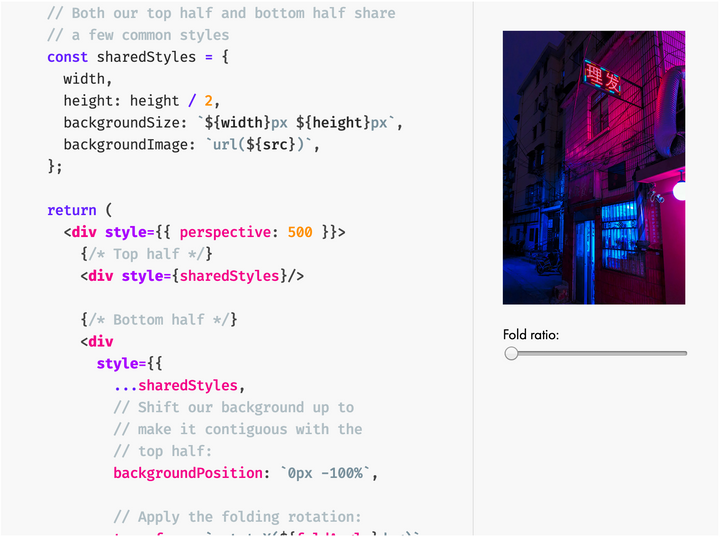
With this tutorial in mind, I created the following React Component.

Hope someone finds this useful!

Read next

Image Generator Module

Image Generator Module

an Exploration on using JavaScript and its Canvas to generate a dataurl image.
Christopher Vachon Sep 25, 2019
Next Version

Next Version

I created a Node.js based Command Line Interface tool for creating and updating a Node Projects Version.
Christopher Vachon May 27, 2019
Folding the DOM

Folding the DOM

I came across this article online and just needed to share it.
Christopher Vachon May 22, 2019

Comments ()

Subscribe to Blog of Christopher Vachon

Don't miss out on the latest news. Sign up now to get access to the library of members-only articles.
Blog of Christopher Vachon © 2023. Powered by Ghost